Now that the NC primary election season has come to an end, it is time to start focusing on Raleigh’s upcoming municipal elections. We are rerunning this blog detailing the unprecedented amount of money the development industry spent in the last City Council election. All signs appear to be saying even MORE development industry money will be thrown at the council candidates this fall. Will you let all this money influence who you vote for?
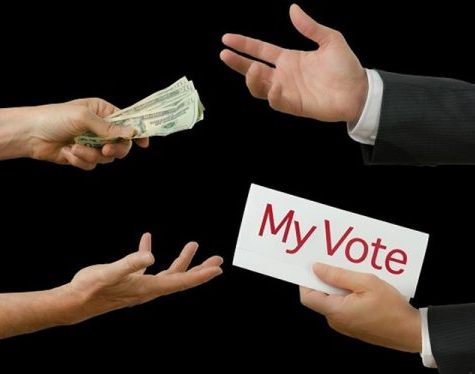
First we “Showed You the Money.” Then we “Followed the Money.” In this third of our series about the money in Raleigh’s politics, we examine the effects of Special Interest money pouring into the city council campaigns.
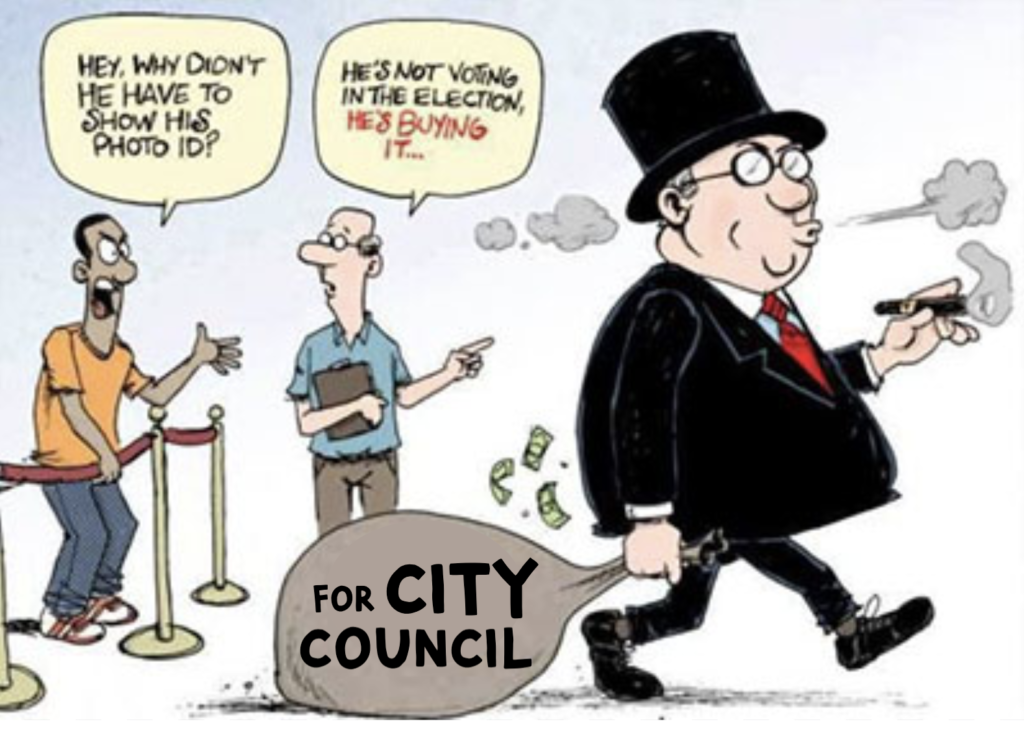
How does it affect City Council elections and the resulting government and policies when special interests pour money into the campaigns? Will good candidates be shut out of city government because these special interests have priced them out of the process going forward?
Let’s compare the cost of running a winning campaign for Raleigh City Council in 2017 to the cost in the most recent campaigns in 2019 when money from the development community flooded the races to buy influence.
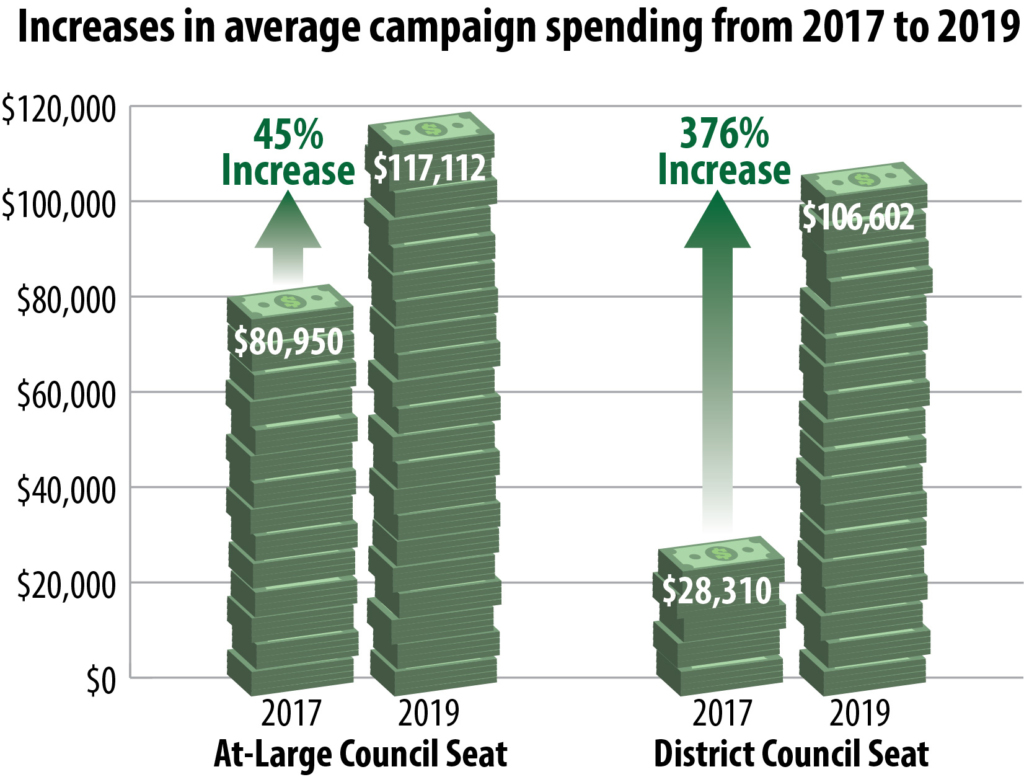
In 2017 the average spent for a city-wide At-Large council race was $80,950. In 2019, that increased to $117,112. An increase of 45%.
In 2017 the average spent for a district seat was $28,310. In 2019, that soared to $106,602. An increase of 376%. Nearly FOUR times the cost.
The below chart shows cost comparisons for individual races between 2017 and 2019. What we can see by the numbers is that each race with a dramatic influx of special interest money was a race where an incumbent was replaced by a candidate funded in large part by the development community. While in one At-Large race and in Districts B and C there was no appreciable increase in spending and the incumbents were returned to office.
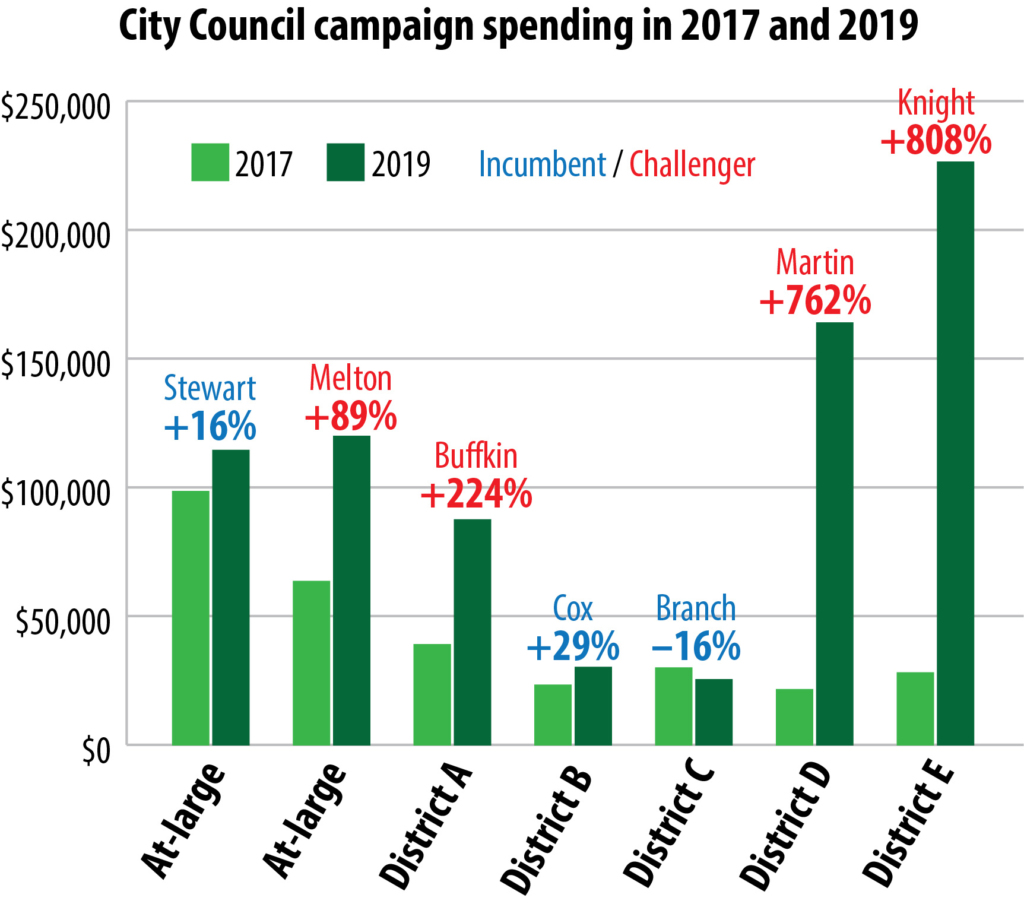
| City Council Race | 2017 Spending | 2019 Spending |
| At-large | $98,400 | $114,375 |
| At-large | $63,500 | $119,850 |
| District A | $38,950 | $87,375 |
| District B | $23,200 | $30,100 |
| District C | $29,900 | $25,350 |
| District D | $21,500 | $163,860† |
| District E | $28,000 | $226,325*† |
About the mayor’s race: We couldn’t make an “apples-to-apples” comparison between 2017 and 2019 campaign spending. This was due to a runoff election in 2017 which did not happen in 2019. Through our public records research, we could not determine the amount of money spent just on the initial election. As a result, we can’t make an accurate comparison between the 2017 and 2019 mayor’s race.
* David Knight’s totals include $34,800 spent for direct mail and digital advertising on his behalf by the NC Property Rights Fund, a registered PAC associated with the NC Association of Realtors.
† An additional $105,000 was spent for direct mail, digital advertising and polling by Triangle Government Alliance, a registered PAC associated with the Triangle Apartment Association. Their filing documents do not detail what amounts were spent for specific candidates. They supported three candidates in the election. David Knight and Saige Martin, who both won. And, Brian Fitzsimmons, who lost. Based on the information available, $35,000, one-third of the total, has been added to each of David Knight’s and Saige Martin’s totals.
